Project: Data Report (Infographics, Report Design)
Purpose: To create a visually-engaging method to relay Barometer's inaugural report on brand suitability data across podcast genres, drawing on audio waveforms as a visual metaphor.
People: Michael P. Maerlender (Designer)
![](https://cdn.myportfolio.com/17453c7d-d2c4-4aaa-bbea-da4ad9474555/ce99660b-bb16-4210-a7fc-2fd97d926cce_rw_3840.png?h=6a58e2690e7b3b53fbf5d4762e2fba66)
![](https://cdn.myportfolio.com/17453c7d-d2c4-4aaa-bbea-da4ad9474555/ed8a2778-7a29-4d65-a72c-740c10f33c8c_rw_3840.png?h=776fcc465d0b93423d2a590e1aa98fd9)
![](https://cdn.myportfolio.com/17453c7d-d2c4-4aaa-bbea-da4ad9474555/098d93fc-11c5-4327-98c2-5771ea494efa_rw_3840.png?h=9d3265951d657bbd5f2a47f170354a81)
![](https://cdn.myportfolio.com/17453c7d-d2c4-4aaa-bbea-da4ad9474555/d0e6b2fd-b23e-4c93-bb1a-eb02e209d3c5_rw_3840.png?h=322b6e424b1b12afb566e593ca1a0927)
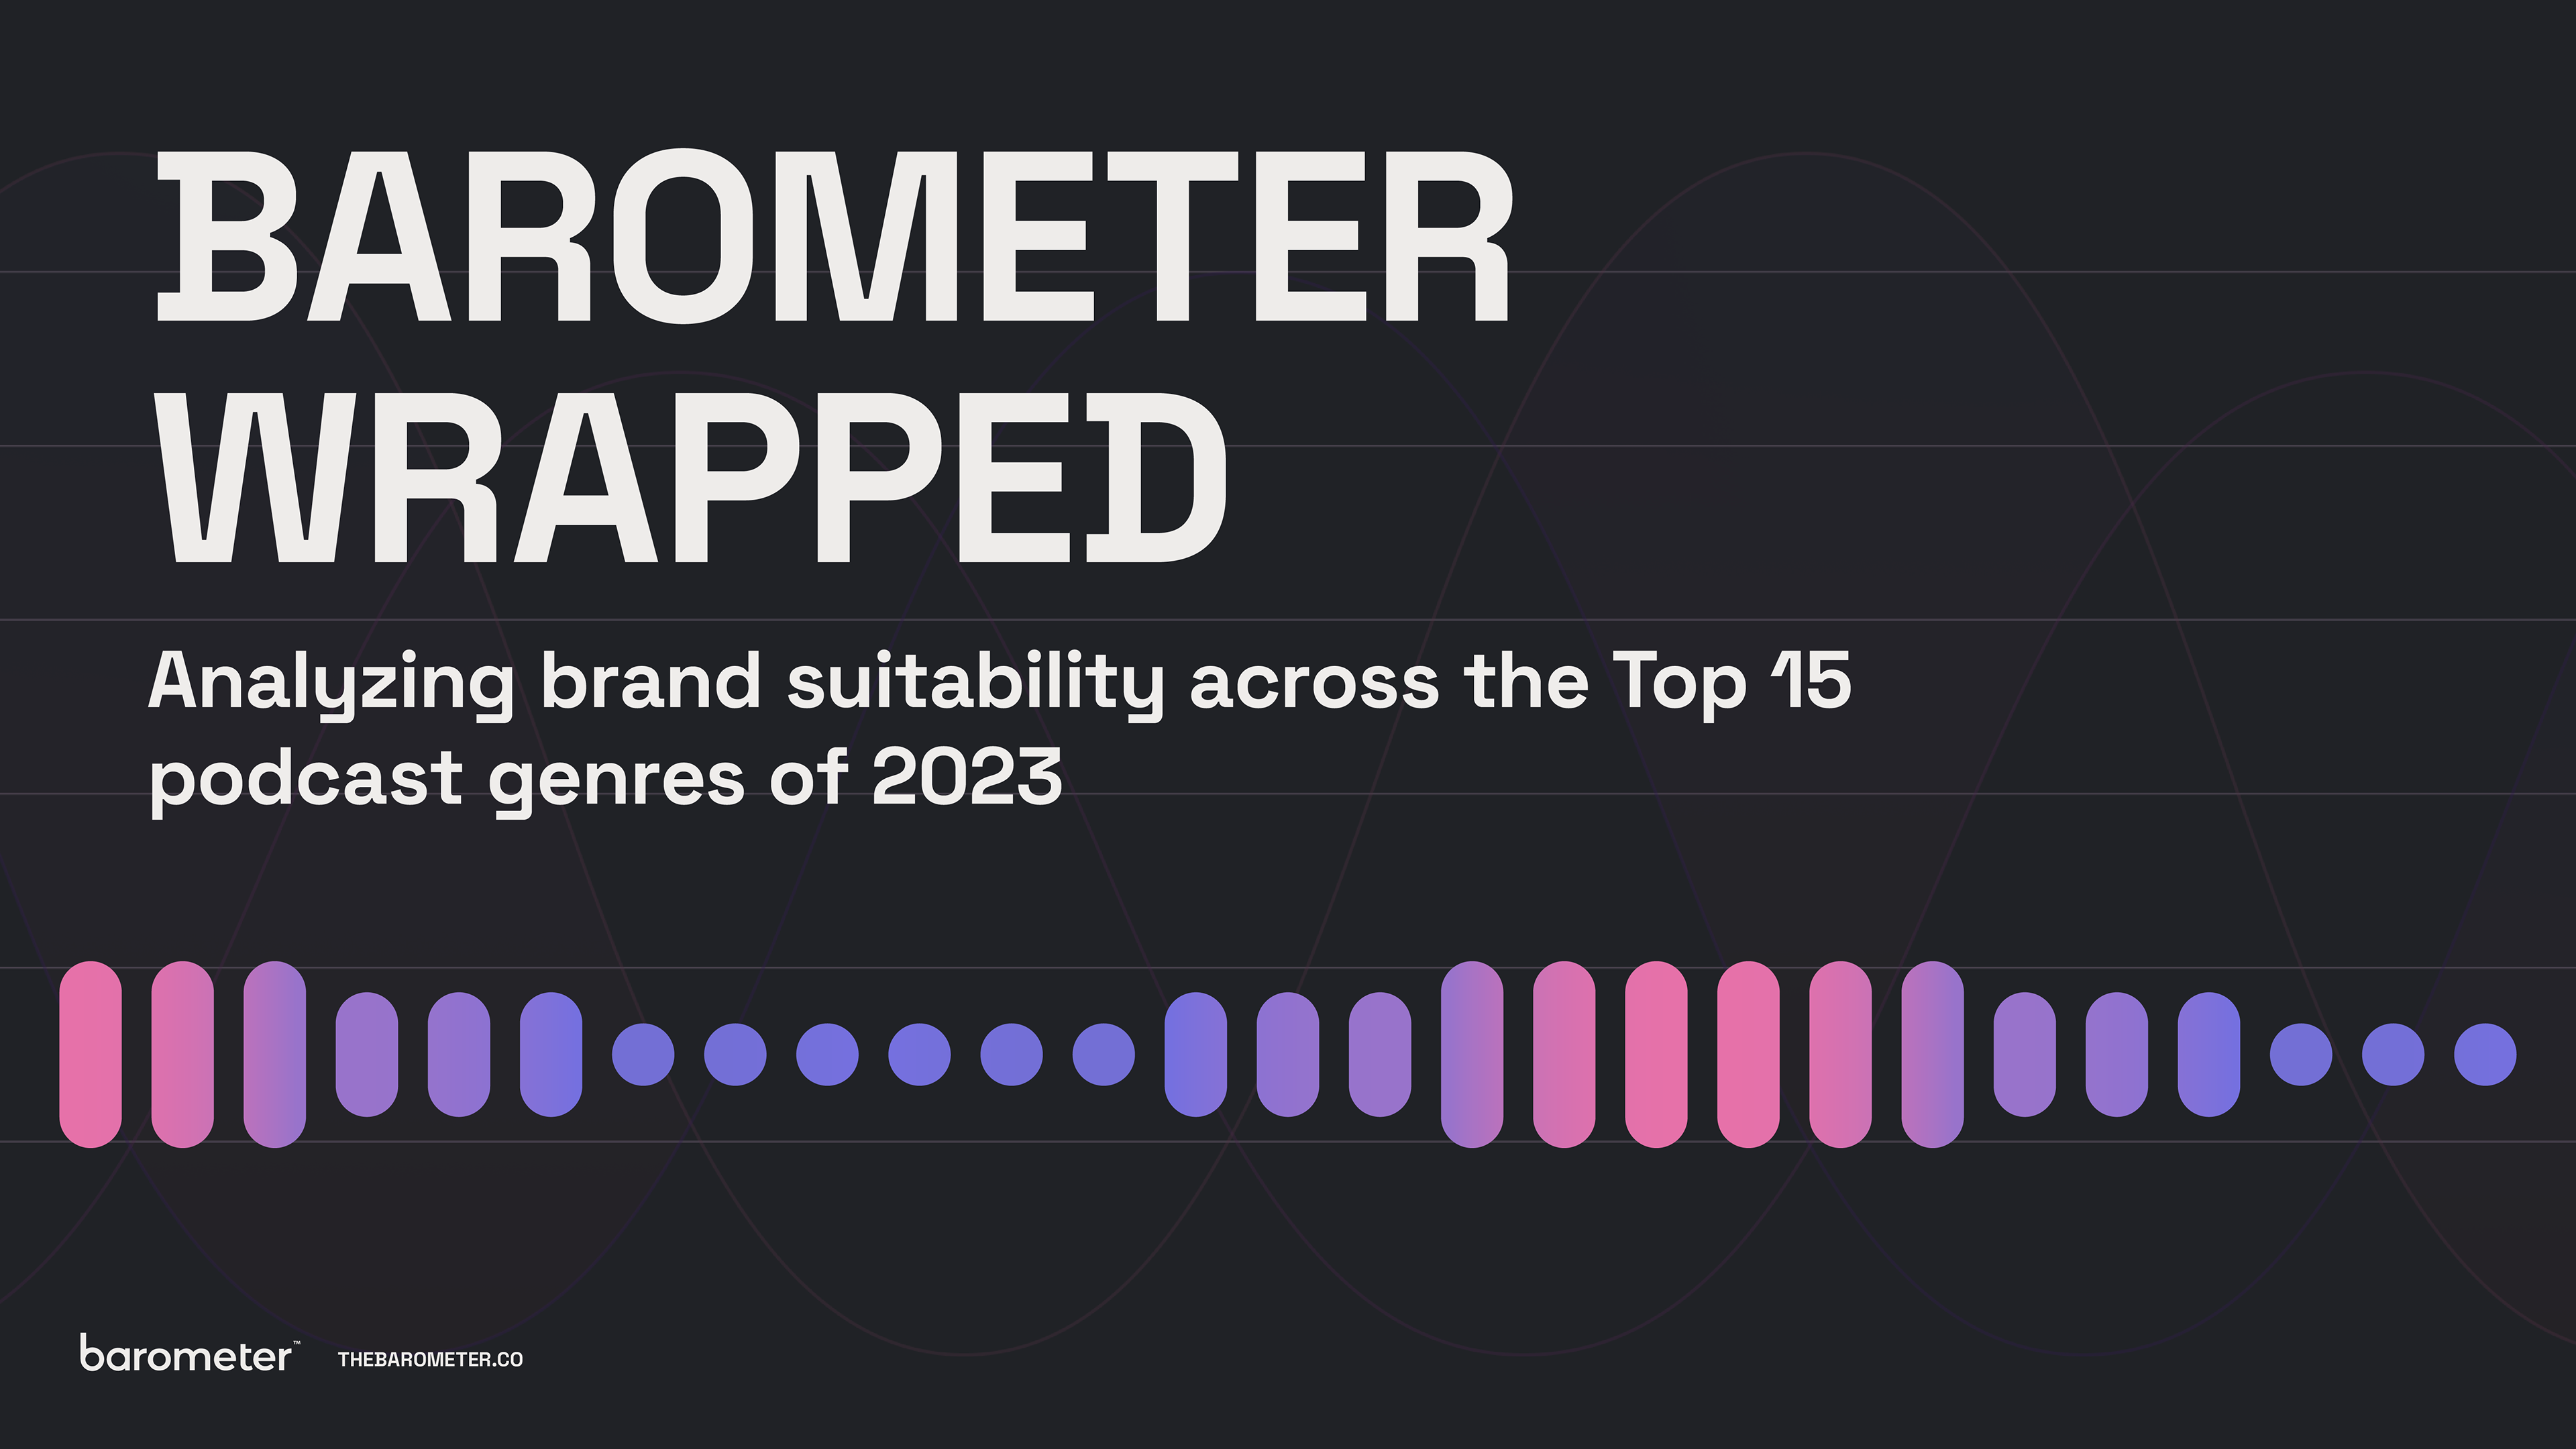
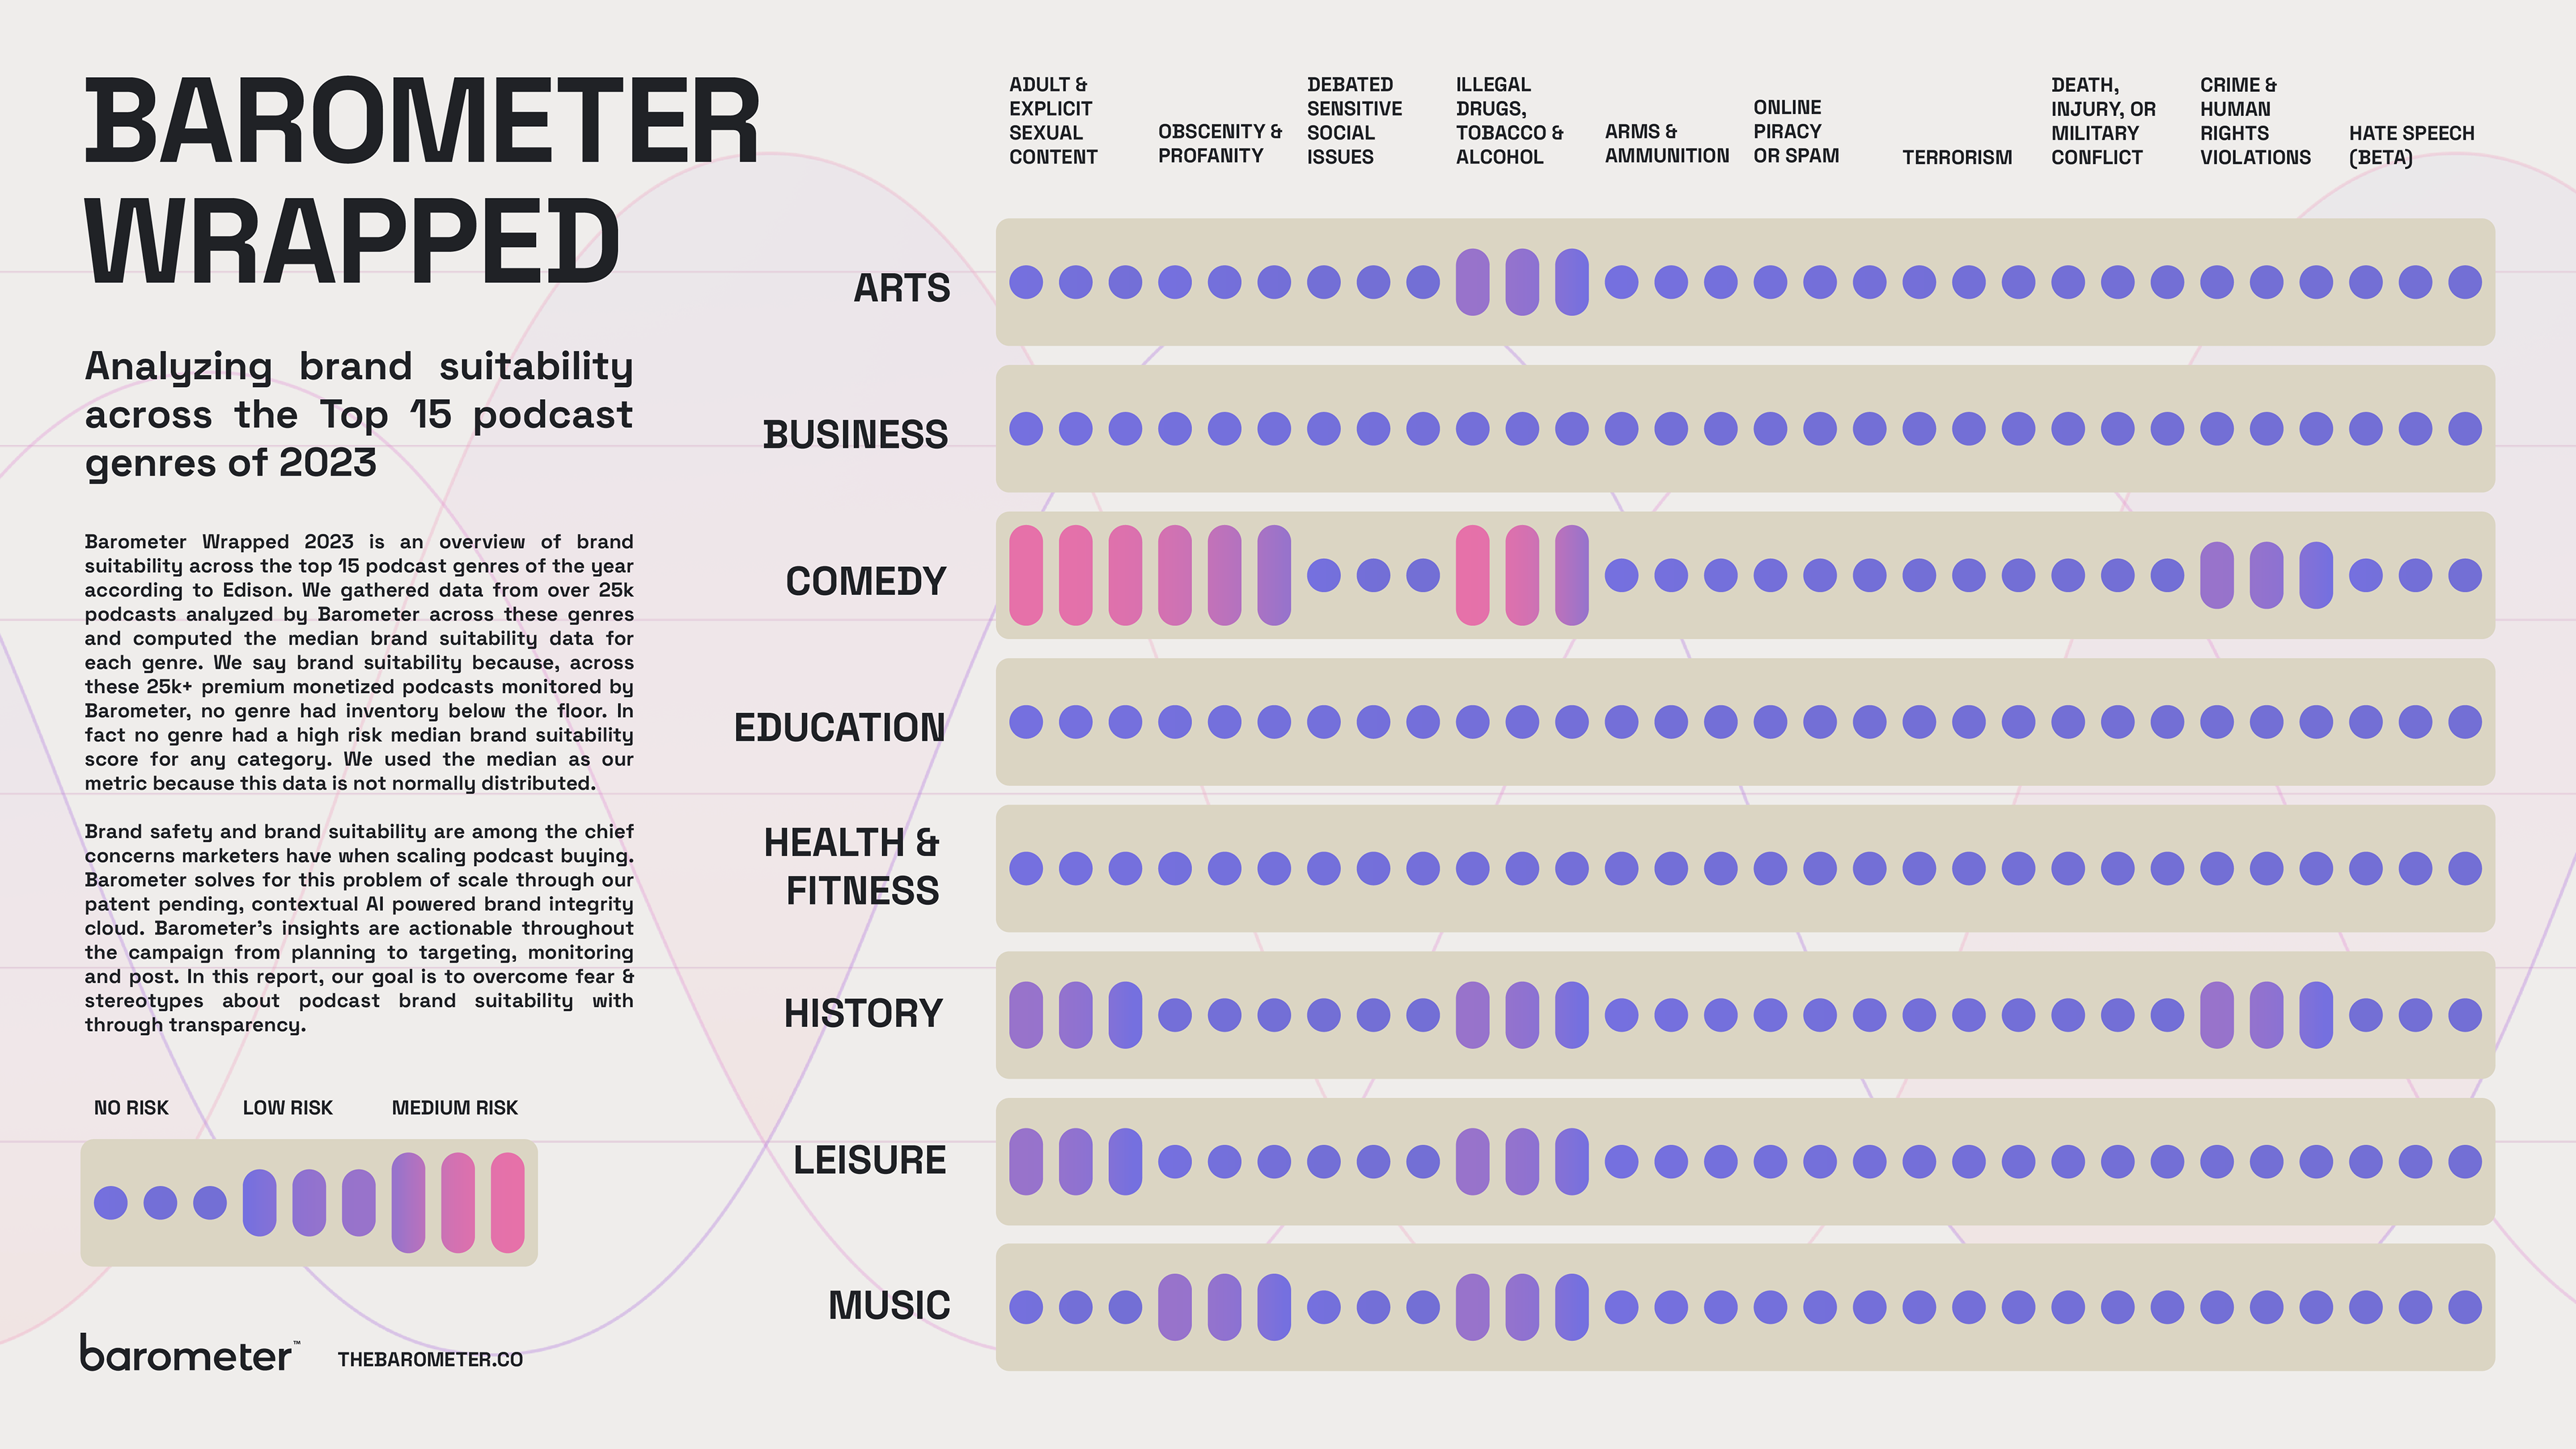
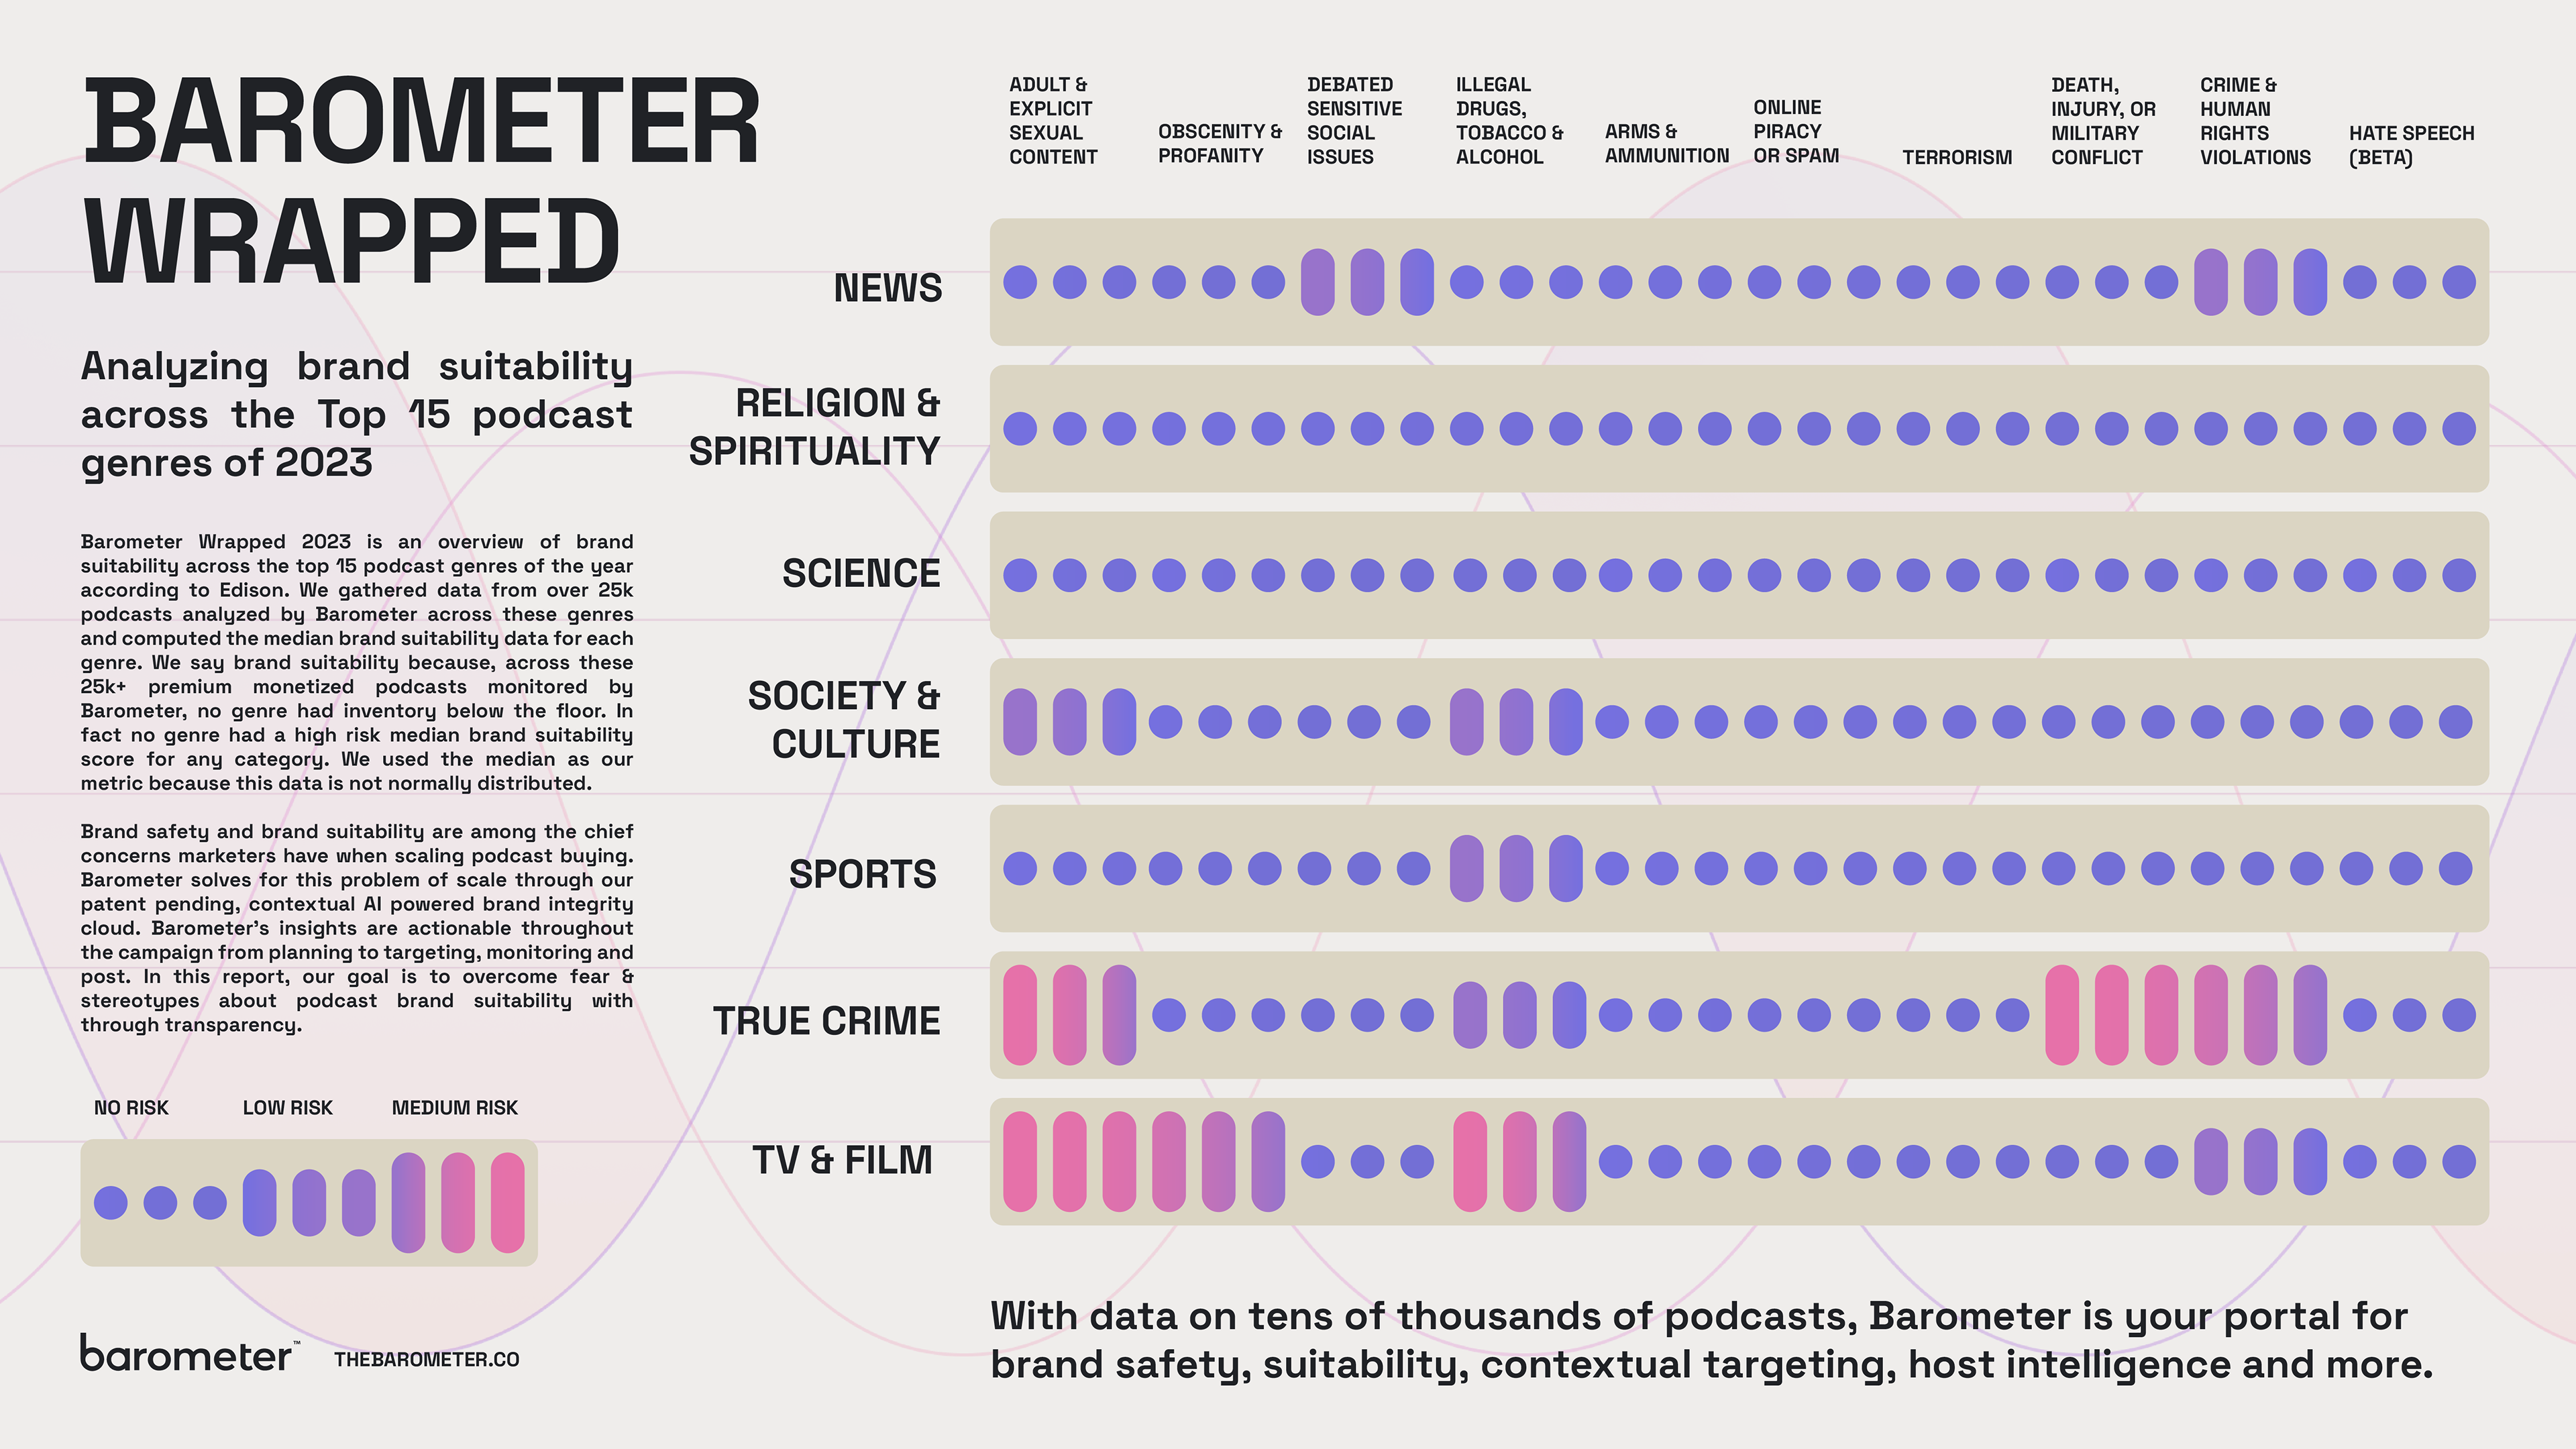
Barometer Wrapped is a visual report analyzing brand suitability and risk for content in 10 categories across the top 15 podcast genres of 2023. Working closely with the Barometer team, I developed the waveform bar graph concept and used it to illustrate levels of risk while keeping the report's appearance engaging and on-brand.